pyANI-plus walkthrough
This section walks through how pyANI-plus can be applied to calculate Average Nucleotide Identity, render graphical and tabular summary output, and perform other related measures for whole genome comparisons. The general procedure for any pyANI-plus analysis is:
- Collect genomes for analysis
- Perform ANI analysis using a chosen method such as ANIb, ANIm, etc.
- Report as tabular output and/or generate a graphical visualisation
- Use the analysis results to classify input genomes and generate species hypotheses
Before using pyANI-plus, make sure to install it on a local machine like a laptop, desktop, server, or cluster. Please see section installation for installation instructions.
Use the command below to generate the help message for pyani-plus:
pyani-plus -hThis is a command-line tool, meaning you type commands into a terminal window to run it. To view avaliable options type pyani-plus (in lower case), space, then -h (minus lower-case H) for the help option, and finally enter or return to run the command.
This should output the following (or similar) - hopefully in colour depending on your terminal setup:
 Usage: pyani-plus [OPTIONS] COMMAND [ARGS]...

╭─ Options ────────────────────────────────────────────────────────────────╮
│ --version             -v        Show tool version (on stdout) and quit.  │
│ --install-completion            Install completion for the current       │
│                                 shell.                                   │
│ --show-completion               Show completion for the current shell,   │
│                                 to copy it or customize the              │
│                                 installation.                            │
│ --help                -h        Show this message and exit.              │
╰──────────────────────────────────────────────────────────────────────────╯
╭─ Commands ───────────────────────────────────────────────────────────────╮
│ resume               Resume any (partial) run already logged in the      │
│                      database.                                           │
│ list-runs            List the runs defined in a given pyANI-plus SQLite3 │
│                      database.                                           │
│ delete-run           Delete any single run from the given pyANI-plus     │
│                      SQLite3 database.                                   │
│ export-run           Export any single run from the given pyANI-plus     │
│                      SQLite3 database.                                   │
│ plot-run             Plot heatmaps and distributions for any single run. │
│ plot-run-comp        Plot comparisons between multiple runs.             │
│ classify             Classify genomes into clusters based on ANI         │
│                      results.                                            │
╰──────────────────────────────────────────────────────────────────────────╯
╭─ ANI methods ────────────────────────────────────────────────────────────╮
│ anim                 Execute ANIm calculations, logged to a pyANI-plus   │
│                      SQLite3 database.                                   │
│ dnadiff              Execute mumer-based dnadiff calculations, logged to │
│                      a pyANI-plus SQLite3 database.                      │
│ anib                 Execute ANIb calculations, logged to a pyANI-plus   │
│                      SQLite3 database.                                   │
│ fastani              Execute fastANI calculations, logged to a           │
│                      pyANI-plus SQLite3 database.                        │
│ sourmash             Execute sourmash-plugin-branchwater ANI             │
│                      calculations, logged to a pyANI-plus SQLite3        │
│                      database.                                           │
│ external-alignment   Compute pairwise ANI from given                     │
│                      multiple-sequence-alignment (MSA) file.             │
╰──────────────────────────────────────────────────────────────────────────╯
To see the options for a specific subcommand, use pyani-plus <subcommand> -h. For example, to view options for the ANIb method:
pyani-plus anib -hExpected output:
 Usage: pyani-plus anib [OPTIONS] FASTA

 Execute ANIb calculations, logged to a pyANI-plus SQLite3 database.

╭─ Arguments ──────────────────────────────────────────────────────────────╮
│ *    fasta      PATH  Directory of FASTA files (extensions .fas, .fasta, │
│                       .fna).                                             │
│                       [required]                                         │
╰──────────────────────────────────────────────────────────────────────────╯
╭─ Options ────────────────────────────────────────────────────────────────╮
│ *  --database   -d      FILE           Path to pyANI-plus SQLite3        │
│                                        database.                         │
│                                        [required]                        │
│    --name               TEXT           Run name. Default is 'N genomes   │
│                                        using METHOD'.                    │
│    --create-db                         Create database if does not       │
│                                        exist.                            │
│    --executor           [local|slurm]  How should the internal tools be  │
│                                        run?                              │
│                                        [default: local]                  │
│    --help       -h                     Show this message and exit.       │
╰──────────────────────────────────────────────────────────────────────────╯
╭─ Method parameters ──────────────────────────────────────────────────────╮
│ --fragsize        INTEGER RANGE [x>=1]  Comparison method fragment size. │
│                                         [default: 1020]                  │
╰──────────────────────────────────────────────────────────────────────────╯
╭─ Debugging ──────────────────────────────────────────────────────────────╮
│ --temp         DIRECTORY  Directory to use for intermediate files, which │
│                           for debugging purposes will not be deleted.    │
│                           For clusters this must be on a shared drive.   │
│                           Default behaviour is to use a system specified │
│                           temporary directory (specific to the           │
│                           compute-node when using a cluster) and remove  │
│                           this afterwards.                               │
│ --wtemp        DIRECTORY  Directory to use for temporary workflow        │
│                           coordination files, which for debugging        │
│                           purposes will not be deleted. For clusters     │
│                           this must be on a shared drive. Default        │
│                           behaviour is to use a system specified         │
│                           temporary directory (for the local executor)   │
│                           or a temporary directory under the present     │
│                           direct (for clusters), and remove this         │
│                           afterwards.                                    │
│ --log          FILE       Where to record log(s). Use '-' for no         │
│                           logging.                                       │
│                           [default: pyani-plus.log]                      │
│ --debug                   Show debugging level logging at the terminal   │
│                           (in addition to the log file).                 │
╰──────────────────────────────────────────────────────────────────────────╯
Collect genomes for analysis
While you can work with your choice of genomes as FASTA files placed in a local directory, we suggest using the ten genomes provided in the compressed folder linked below when first following this walkthrough, to ensure the output matches the expected results.
To uncompress this folder, either use your operating system’s built-in tools in the file explorer, or use a command like:
unzip walkthrough_data.zippyANI-plus accepts FASTA files with the extensions .fasta, .fas, and .fna, and gzip compressed formats like .fasta.gz, .fas.gz, and .fna.gz. Please make sure that your input files match these extensions to ensure that pyANI-plus works.
Conducting ANI analysis
pyANI-plus enables genome comparison using various ANI methods.
In this walkthrough, we will demonstrate methods including ANIm, ANIb, dnadiff, fastANI, and sourmash. We recommend trying several of these methods on the walkthrough dataset, so their results can be compared using the plot-run-comp command.
Running any ANI method on requires that you specify the directory containing the genome data (e.g., walkthrough_data/), and the path to the pyANI-plus SQLite3 database (walkthrough.db for this walkthrough).
If this is your first analysis and the SQLite3 database does not yet exist, you must use the --create-db option; otherwise, you will encounter the following error:
ERROR: Database walkthrough.db does not exist, but not using --create-dbOptionally, you can provide a custom name for the analysis with the --name option for easier reference.
If you want to run the ANI analysis on a cluster using SLURM, you must set the execution method using --executor slurm (the default is --executor local).
Conduct ANIm analysis
We first run ANIm analysis on the downloaded genomes, and creating the local database, using the command line:
pyani-plus anim walkthrough_data/ --database walkthrough.db --create-db --name "walkthrough ANIm"With the walkthrough dataset this should take about 2-5 minutes on a recent multi-core desktop or laptop computer.
In ANIm analysis, the default setting uses anchor matches that are unique in the reference but not necessarily unique in the query (--mode mum). You can change this to include all anchor matches, regardless of their uniqueness, by setting the --mode option to maxmatch.
Conduct ANIb analysis
To run ANIb analysis on the downloaded genomes use the command line:
pyani-plus anib walkthrough_data/ --database walkthrough.db --name "walkthrough ANIb"With the suggested ten genomes this should take about 5-10 minutes on a recent multi-core desktop or laptop computer. The other methods should all be considerably faster.
If you wish you can select a different fragment size for the comparison method using the --fragsize option. The default fragment size is 1020bp (listed in the help output shown earlier), which is typically used for ANIb.
Conduct dnadiff analysis
To compare genomes in the input walkthrough_data directory using the dnadiff method use the following command line:
pyani-plus dnadiff walkthrough_data/ --database walkthrough.db --name "walkthrough dnadiff"With the walkthrough dataset this should take about 2-5 minutes on a recent multi-core desktop or laptop computer.
Conduct fastani analysis
To run fastani analysis on the genomes in the input walkthrough_data directory use the following command line:
pyani-plus fastani walkthrough_data/ --database walkthrough.db --name "walkthrough fastani"With the walkthrough dataset this should take less than 30 seconds on a recent multi-core desktop or laptop computer.
In fastani analysis, additional method parameters can be changed by the user. These include:
--fragsize: Fragment length used in the analysis (default:3000).--kmersize: k-mer size, set to16by default. It can be set to any value smaller than 16.--minmatch: Minimum fraction of the genome that must be shared for ANI to be considered reliable. If the reference and query genome sizes differ, the smaller genome is used. (Default:0.2).
Conduct sourmash analysis
Lastly, we can run sourmash analysis with the following command line:
pyani-plus sourmash walkthrough_data/ --database walkthrough.db --name "walkthrough sourmash"With the walkthrough dataset this should take less than 15 seconds on a recent multi-core desktop or laptop computer.
For sourmash analysis, additional method parameters can be changed by the user. These include: - --scaled: Compression ration (defult: 1000) - --kmersize: k-mer size (default: 31)
Reporting Analyses and Analysis Results
List all runs in the database
pyANI-plus enables you to view all runs defined in a SQLite3 database. To display all runs from the database (eg. walkthrough.db for this walkthrough), use this command:
pyani-plus list-runs --database walkthrough.dbYou should see the following table, or something similar, depending on the analyses contained within the database:
                              5 analysis runs in walkthrough.db
┏━━━━┳━━━━━━━━━━━━┳━━━━━━━━━━┳━━━━━━┳━━━━━━┳━━━━━━┳━━━━━━━━━┳━━━━━━━━┳━━━━━━━━━━━━━━━━━━━━━━┓
┃ ID ┃ Date       ┃ Method   ┃ Done ┃ Null ┃ Miss ┃ Total   ┃ Status ┃ Name                 ┃
┡━━━━╇━━━━━━━━━━━━╇━━━━━━━━━━╇━━━━━━╇━━━━━━╇━━━━━━╇━━━━━━━━━╇━━━━━━━━╇━━━━━━━━━━━━━━━━━━━━━━┩
│  1 │ 2025-03-17 │ ANIb     │  100 │    0 │    0 │ 100=10² │ Done   │ walkthrough ANIb     │
│  2 │ 2025-03-17 │ ANIm     │   68 │   32 │    0 │ 100=10² │ Done   │ walkthrough ANIm     │
│  3 │ 2025-03-17 │ dnadiff  │  100 │    0 │    0 │ 100=10² │ Done   │ walkthrough dnadiff  │
│  4 │ 2025-03-17 │ fastANI  │   68 │   32 │    0 │ 100=10² │ Done   │ walkthrough fastani  │
│  5 │ 2025-03-17 │ sourmash │   68 │   32 │    0 │ 100=10² │ Done   │ walkthrough sourmash │
└────┴────────────┴──────────┴──────┴──────┴──────┴─────────┴────────┴──────────────────────┘
In this table, each row represents a single run, and the columns provide the following information:
ID: Unique ID for the runDate: Date when the analysis was executedMethod: ANI method usedDone: Number of completed ANI comparisonsNull: Number of analyses where no alignment was found (e.g., comparisons between highly divergent genomes)Miss: Number of comparisons that were not completedStatus: Current status of the analysis—e.g.,Donefor completed analyses,Runningfor comparisons that have started but are still in progressName: Run name.
Exporting ANI results in tabular format
pyANI-plus allows ANI results to be exported in a tabular format. We use the following command to export results for the ANIb analysis:
pyani-plus export-run --database walkthrough.db --outdir walkthrough_output/ --run-id 1If --run-id is not specified the latest run will be exported. To export runs for other analyses, you can specify the --run-id by matching the ID number provided in the table provided by list-runs subcommand.
This will report the relevant information to new files in the walkthrough_output/ directory. The matrix output files are named <method>_<property>.tsv while the long (tidy) format output is named <method>_run_<run-id>.tsv.
.
├── ANIb_aln_lengths.tsv
├── ANIb_hadamard.tsv
├── ANIb_identity.tsv
├── ANIb_query_cov.tsv
├── ANIb_run_1.tsv
├── ANIb_sim_errors.tsv
└── ANIb_tANI.tsv
The long format file will include the query and subject genomes and all the comparison properties as columns:
#Query  Subject Identity    Query-Cov   Subject-Cov Hadamard    tANI    Align-Len   Sim-Errors
GCF_002950395.1_ASM295039v1_genomic GCF_014836715.1_ASM1483671v1_genomic 0.9154744964243148 0.672804430756021 NA 0.6159352974384161 0.4846133575912978 3359986 284072- Incomplete runs will return an error.
- There will be no output for an empty run.
- For partial runs the long form table of completed comparisons will be exported, but not the matrices.
Graphical output
Graphical output (JPG, PDF, PNG and SVGZ formats) is obtanined by executing the pyani-plus plot-run subcommand, specifying the database and ouput directory:
pyani-plus plot-run --database walkthrough.db --outdir walkthrough_output/ --run-id 2If --run-id is not specified the latest run will be used to generate graphical output. To generate graphical output for other analyses, you can specify the --run-id by matching the ID number provided in the table provided by list-runs subcommand.
Optionally, you can label genomes using md5 and filename using the --label option.
plot-run subcommand generates the following heatmaps, distribution plots, and tabular output from an ANI analysis for a specified --run_id, using data stored in a local SQLite3 database:
- percentage identity of aligned regions (
<method>_idenity_heatmap.<extension>,<method>_identity_dist.<extension>and<method>_identity.tsv, Figure 1)
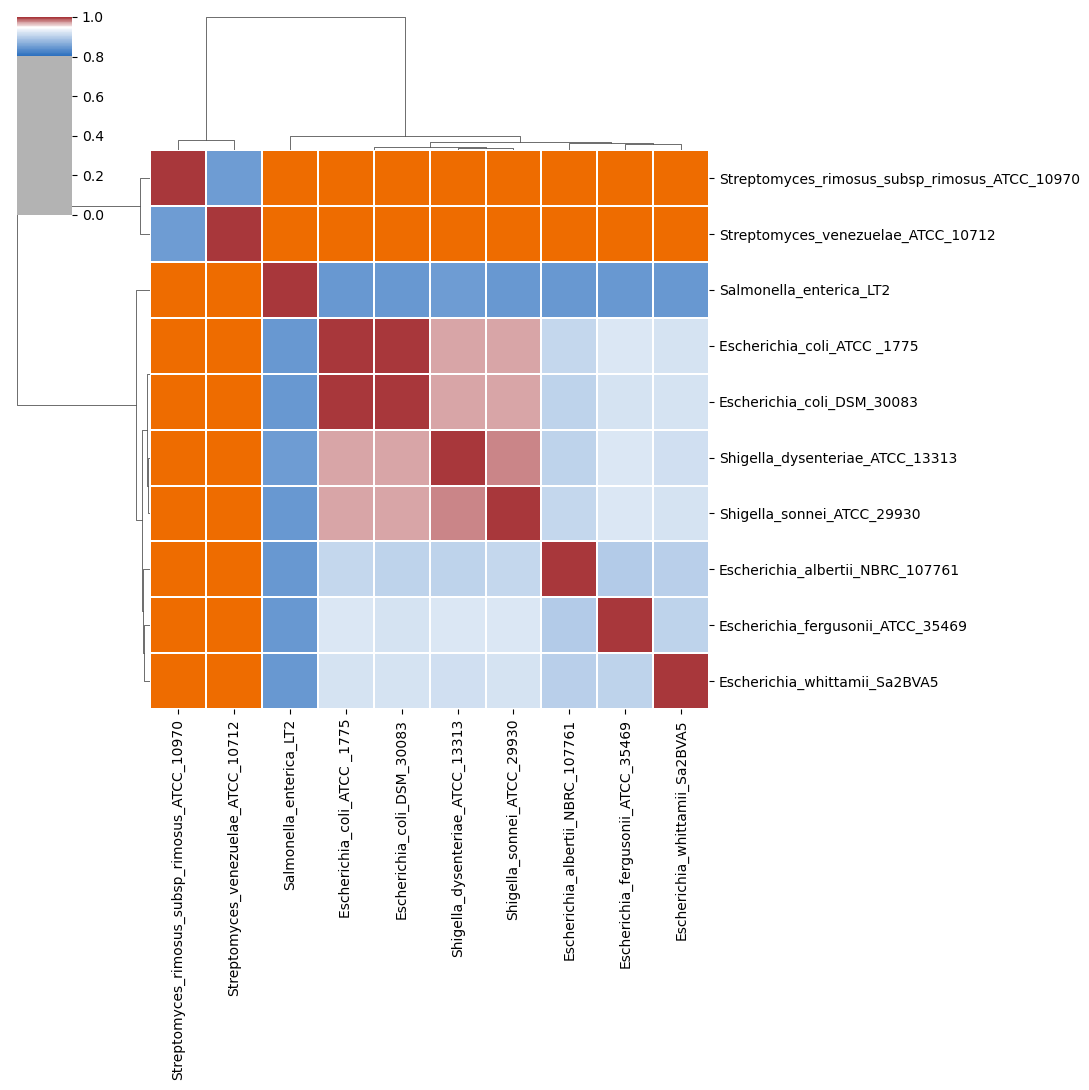
In the above heatmap, each cell represents a pairwise comparision between the genomes shown in the rows and columns, showing the pairwise identity of aligned regions. The dendrograms are single-linkage clustering trees generated from the matrix of pairwise identity results. The default color scheme assigns red to cells with identity \(\geq 0.95\), blue to those with identity \(<0.95\), and orange to cells representing comparisons with no alignment found (e.g., NULLs). This division corresponds to a widely-used convention for bacterial species boundaries.
- percentage coverage of each query genome by aligned regions (
<method>_query_cov_heatmap.<extension>,<method>_query_cov_dist.<extension>,<method>_query_cov_scatter.<extension>and<method>_query_cov.tsv)
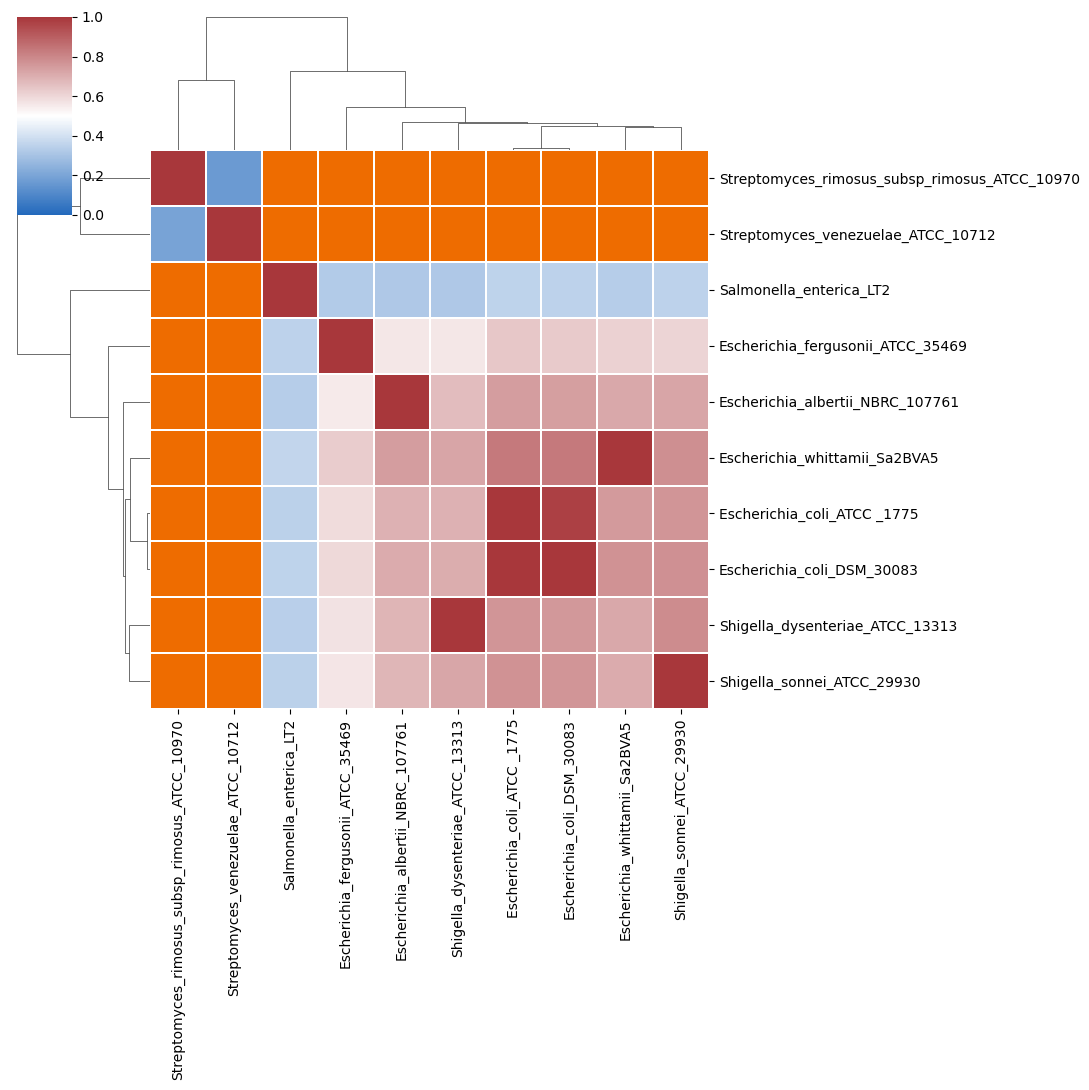
In the above heatmap, each cell represents a pairwise comparision between the genomes shown in the rows and columns, showing the pairwise coverage of each genome by aligned regions in the comparison. The dendrograms are single-linkage clustering trees generated from the matrix of pairwise coverage results. The default color scheme assigns red to cells with coverage \(\geq 0.50\), blue to those with coverage \(<0.50\), and orange to cells representing comparisons with no alignment found (e.g., NULLs). This division corresponds to a strict majority of each genome in the comparison being alignable (a plausible minimum requirement for two sequences being considered “the same thing”).
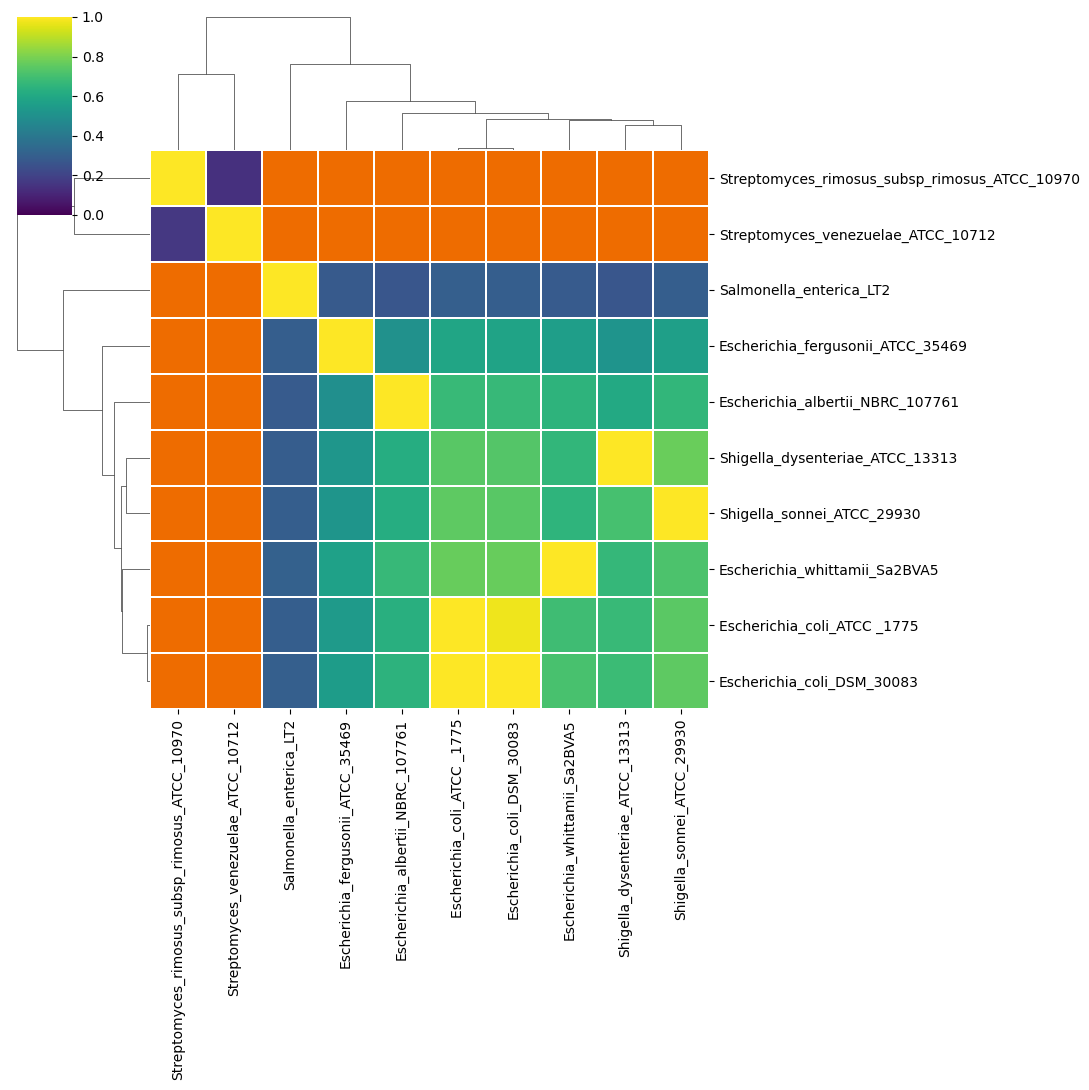
- a Hadamard matrix of percentage identity multiplied by percentage coverage for each comparison (
<method>_hadamard_heatmap.<extension>,<method>_hadamard_dist.<extension>and<method>_hadamard.tsv)
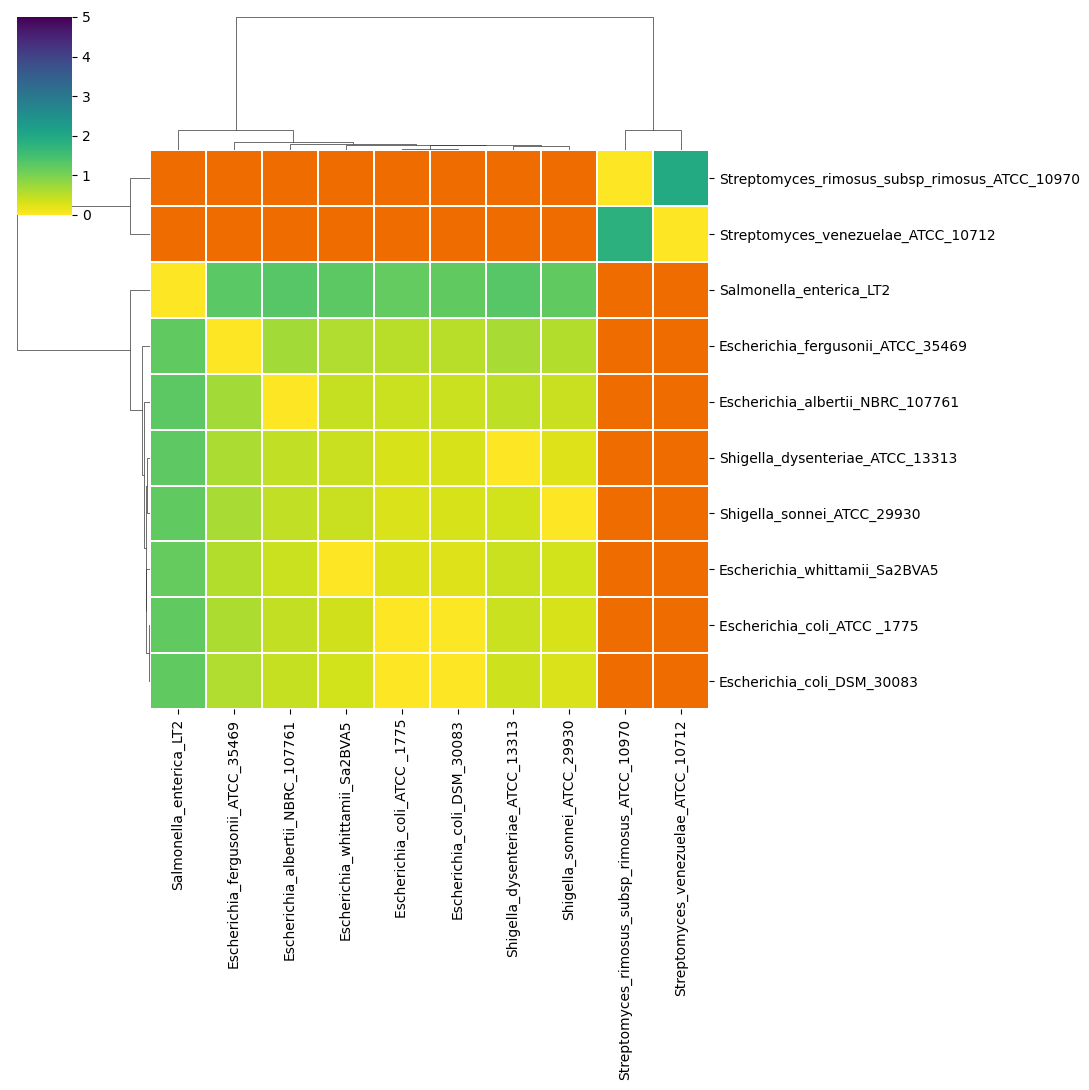
- a total Avenarge Nucleotide Identity (tANI) matrix of he negative log of the coverage multiplied by identity (
<method>_tANI_heatmap.<extension>,<method>_tANI_dist.<extension>,<method>_tANI_scatter.<extension>and<method>_tANI.tsv)
- number of “similarity errors” on each genome (
<method>_sim_errors.tsv) - Long form of ANI results which include the query and subject genomes and all the comparison properties as columns (
<method>_run_<ID>.tsv)
Plotting comparisons between runs
ANI results can vary depending on the method used. pyANI-plus allows you to compare the ANI results from multiple runs. In this example, we show how to use the pyani-plus plot-run-comp subcommand to visualise and compare these results. Running pyani-plus plot-run-comp requires specifying the output directory (e.g., walkthrough_output/), the path to the pyANI-plus SQLite3 database (walkthrough.db for this walkthrough), and a comma-separated list of run IDs for comparison.
The first run ID will be treated as the reference, and all subsequent runs will be compared to it.
In this example, we use ANIb as the reference method, with other methods compared against it.
pyani-plus plot-run-comp --database walkthrough.db --outdir walkthrough_output/ --run-ids 1,2,3,4,5This command generates the following outputs:
- A set of scatterplots where the X-axis represents genome identity from the reference method (here, ANIb), and the Y-axis represents genome identity from the compared methods/runs (
<reference_method>_identity_<run_ID>_scatter_vs_others.<extension>).
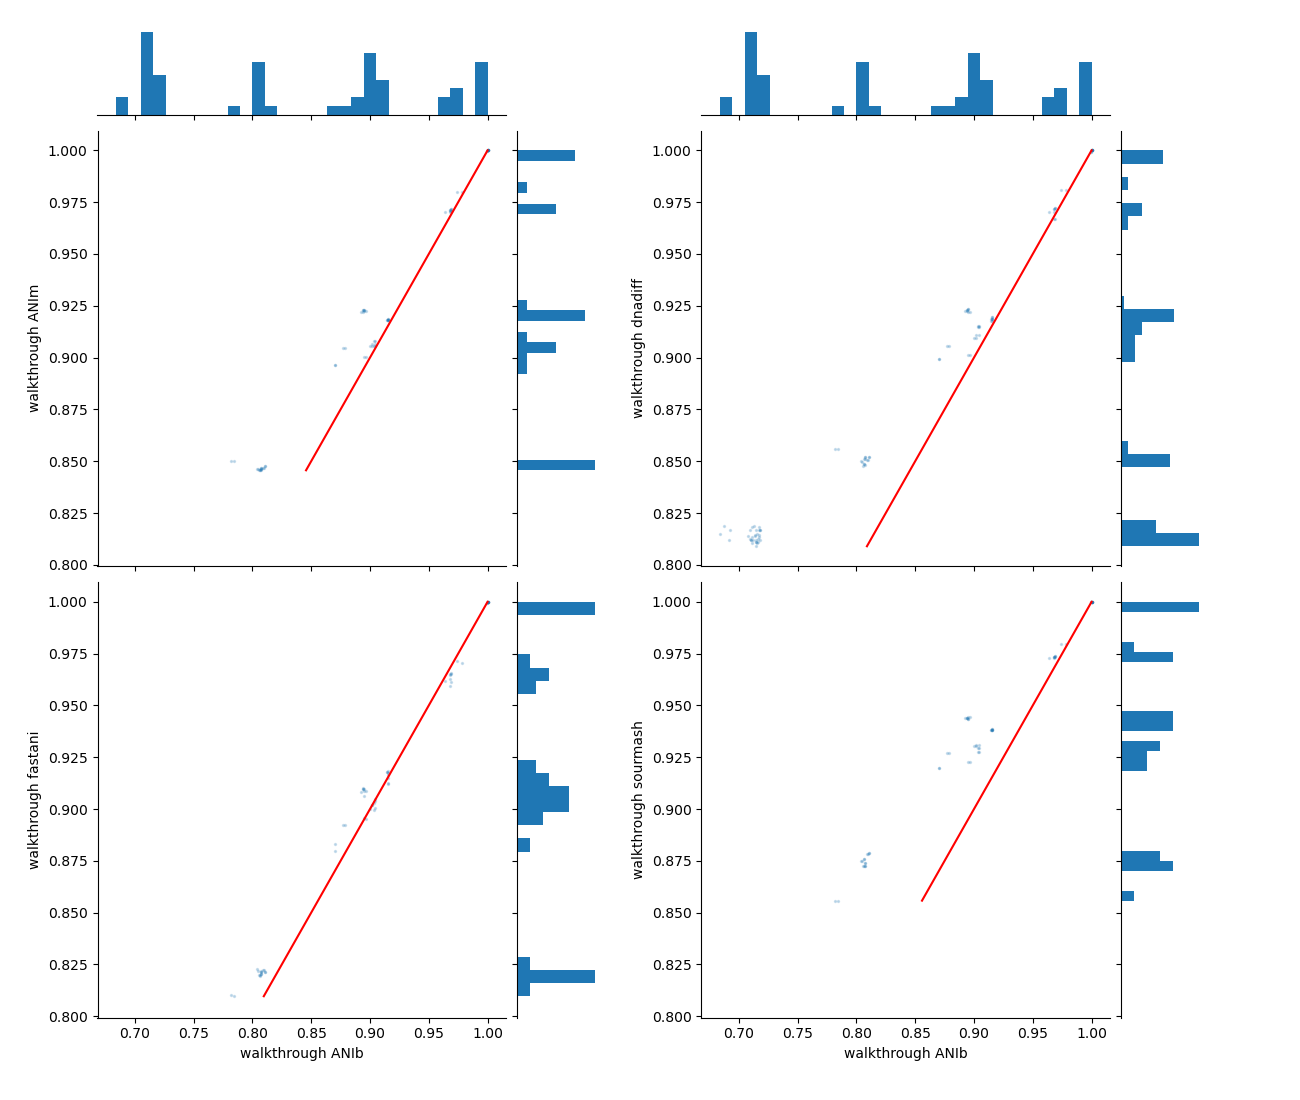
pyani-plus plot-run-comp subcommandThe red diagonal line serves as a reference (x-axis values equal y-axis values), indicating where data points would align on the scatterplot if the methods being compared give the same values.
- A set of scatterplots showing absolute differences between pairwise comparisons, with the X-axis representing genome identity from the reference method (here, ANIb) and the Y-axis showing the difference in genome identity for the compared methods/runs.
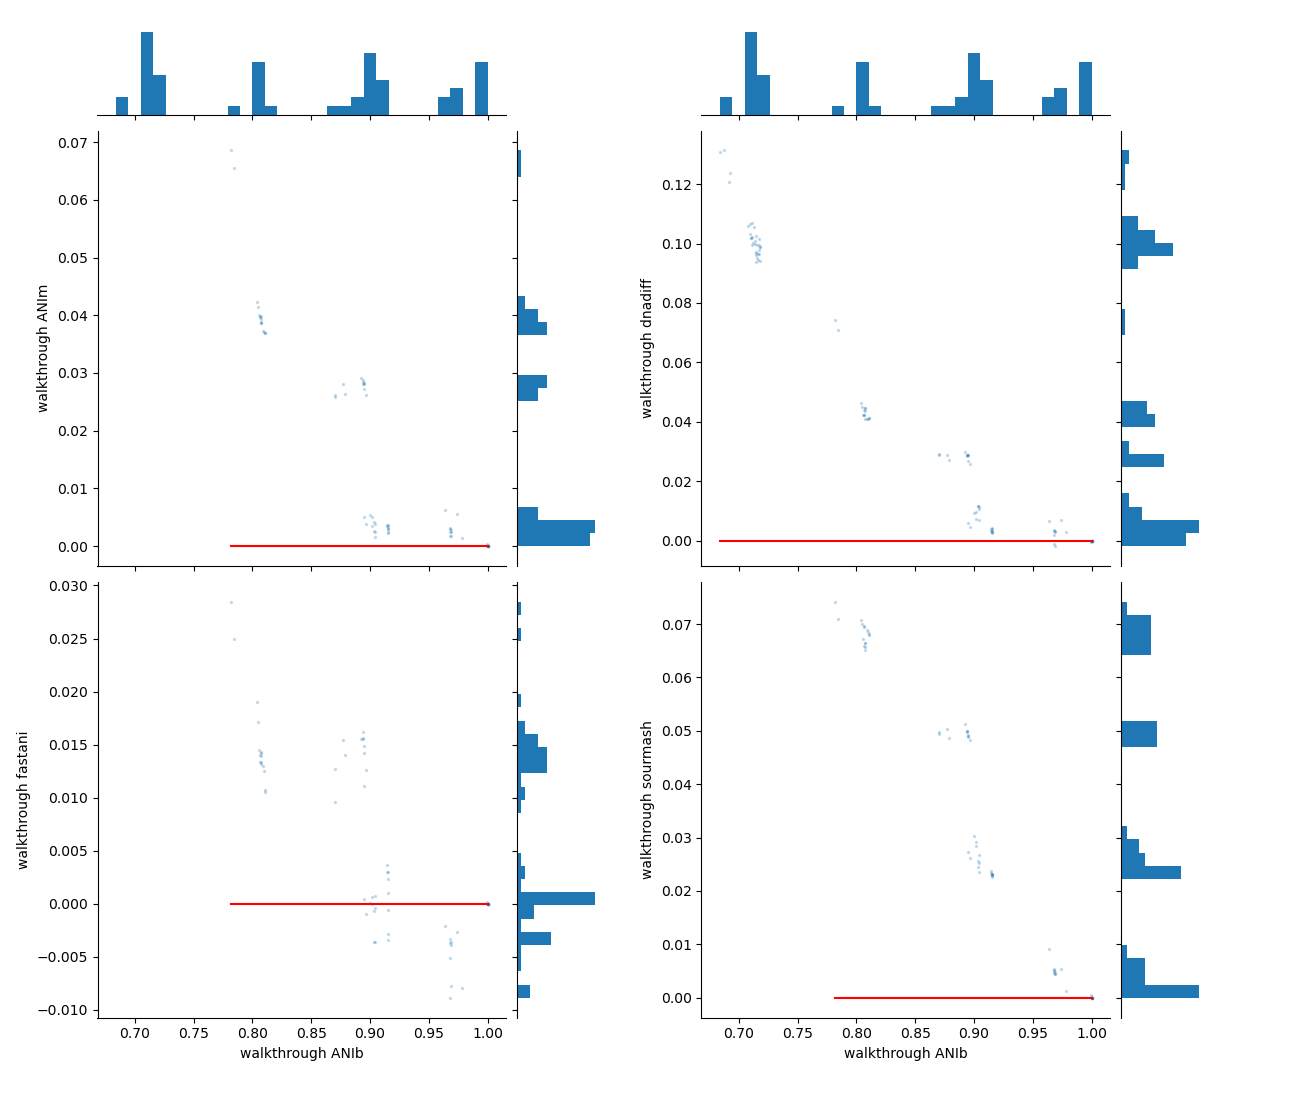
pyani-plus plot-run-comp subcommandThe red horizontal line at 0 indicates no difference between the pairwise comparison results across methods.
- Tabular summary of the comparison output (
<reference_method>_identity_<run_ID>_vs_<run_ID>.tsv).